How to Calculate Sales Commission: A Step-by-Step Guide With Worked Examples

TL;DR
To calculate sales commission, multiply the commissionable sales amount by the commission rate. A $40,000 sale at 8% earns $3,200. Base-plus-commission plans add that figure to salary, and tiered plans apply each tier's rate only to the sales inside it. The hard part is agreeing which deals count and what the rate applies to.
Three core formulas cover almost every plan. Straight commission is Commission = Sales × Rate. Base plus commission is Total pay = Base salary + (Sales × Rate). Tiered commission adds up each tier separately: (Tier 1 sales × Tier 1 rate) + (Tier 2 sales × Tier 2 rate), and so on for every tier the rep reaches.
This guide shows why most payout errors come from deciding which deals count rather than from the calculation itself. It explains why tiered plans can pay very different amounts depending on whether tiers are marginal or retroactive, and it covers why payouts should be locked once approved, so later CRM changes don't alter what has already been paid.
What Is Sales Commission?
Sales commission is the variable pay a salesperson earns for the results they bring in, usually a percentage of the sale or a fixed amount per deal. It is calculated on an agreed base, such as revenue, contract value or margin, and paid on a set schedule.
Most salespeople earn a base salary plus variable pay. Together, the two make up OTE (on-target earnings): what the rep earns at 100% of their target. Commission is the part of that variable pay tied directly to results.
Companies use commission because:
- It links pay to performance.
- It aligns reps with company goals, for example new revenue, margin or retention.
- It attracts and keeps high performers.
- It keeps fixed costs flexible, since pay rises and falls with sales.
But commission only motivates when reps understand how it works and can see what they have earned. A plan nobody can check is a plan nobody trusts.
Commission vs Bonus vs SPIF
Commission is often confused with bonuses and SPIFs, and many plans use all three. Before you calculate anything, it helps to know which type of pay you're dealing with, because each one is triggered and paid differently. The table below compares them side by side.
Key Terms You Need Before Calculating
Commission plans come with their own vocabulary, and a misunderstood term is one of the most common reasons two people calculate different payouts for the same deal.
These are the terms used throughout the rest of this guide, so it's worth a quick look before moving on to the formulas.
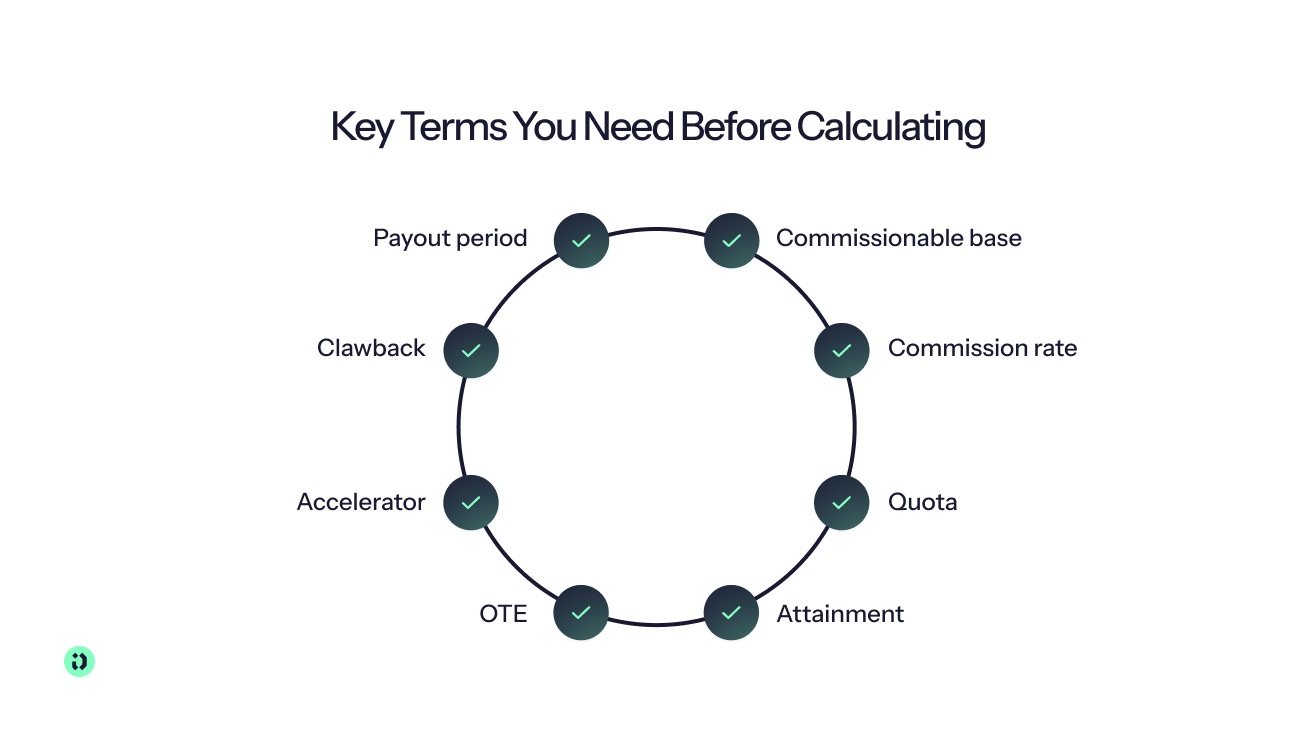
- Commissionable base: the amount commission is calculated on (revenue, contract value, margin or collected cash).
- Commission rate: the percentage or fixed amount applied to that base.
- Quota: the sales target for a period.
- Attainment: actual sales ÷ quota, as a percentage.
- OTE: base salary + target variable pay at 100% attainment.
- Accelerator: a higher rate once a threshold (usually quota) is passed.
- Clawback: taking back commission already paid, for example when a customer cancels.
- Payout period: how often commission is calculated and paid (monthly, quarterly or yearly).
The Sales Commission Formula (And Its 3 Variants)
At its core, every commission calculation multiplies a base by a rate. What changes from plan to plan is how that base is defined and whether the rate stays fixed or moves as the rep sells more. Almost every plan you'll come across is a version of one of the three formulas below, so once you understand these, you can read and check most commission statements. For each one, you'll find the formula, what it means in plain terms, and a worked example you can check against your own numbers.
1. Straight Commission
Commission = Sales × Rate
Straight commission is the simplest structure: the rep earns a fixed percentage of every sale and nothing else. There's no base salary, so income rises and falls entirely with results. You'll find it most often in real estate, insurance, retail and among independent or freelance sales agents.
Example: $40,000 in sales × 8% = $3,200.
Because all of the rep's pay depends on closed sales, straight commission is easy to calculate and easy for reps to understand. The trade-off is income stability: a slow month means a small paycheck, which is why most salaried B2B teams use one of the two structures below instead.
2. Base Salary Plus Commission
Total Pay = Base Salary + (Sales × Rate)
Base salary plus commission combines guaranteed income with a performance-linked upside. The base covers the rep's time on work that doesn't close immediately, such as prospecting and managing long sales cycles, while the commission rewards results. It's the most common structure in B2B sales.
Example: a $4,000 monthly base plus 5% on $60,000 in sales ($3,000) = $7,000 for the month.
When you calculate this, keep the two parts separate on the statement. The base is fixed for the period regardless of sales, so only the commission line should change from month to month. That makes it much easier for reps to check the number and spot an error.
3. Tiered Commission
Commission = Sum of (Sales Within Each Tier × That Tier's Rate)
Tiered commission raises the rate as sales grow, rewarding reps who push past each threshold. Each rate applies only to the sales inside its tier, so a rep never earns less by selling more. This is known as the marginal method. Some plans use the retroactive method instead, where the top rate reached applies to every sale, which works very differently and costs much more.
Example: 4% on the first $50,000, 7% from $50,000 to $100,000, and 10% above $100,000. The rep sells $120,000.
Notice that the rep's effective rate here is $7,500 ÷ $120,000 = 6.25%, well below the 10% top rate. That's normal for marginal tiers, and it's the figure to use when you compare your plan's cost against benchmarks. Tiered plans are also where most calculation errors creep in, especially when the plan document doesn't state which tier method applies.
What's a Good Commission Rate? Benchmarks By Role and Industry
It's the question almost every rep asks at some point: is my commission rate normal? The honest answer is that there's no universal “good” rate. A percentage only means something once you know three things about the plan behind it.
What the rate is applied to. A rate is always a percentage of something, and that something varies widely. 10% of first-year contract value and 25% of gross profit can pay exactly the same amount on the same deal, so comparing the two percentages directly tells you very little. Always check the commissionable base before comparing rates.
Sales cycle and deal size. Larger, slower deals usually carry lower percentages, because a smaller share of a bigger deal still pays well. An enterprise AE on 7% can easily out-earn an SMB rep on 12% if their deals are five times the size.
Pay mix. A rep with a high base salary needs a lower rate to reach the same OTE, while a rep with little or no base needs a higher one to make the role worthwhile. Two plans with very different rates can deliver identical total pay.
With that context in mind, the table below gives typical ranges by role and industry, along with what each rate is applied to and where the figure comes from. Treat these as a starting point for comparison rather than a target: the right rate for your team depends on your margins, deal sizes and how much of each rep's pay is variable.
A few patterns stand out. Rates on new business are consistently higher than on renewals or expansion, because winning a new customer takes more effort than keeping an existing one. Rates applied to profit, as in car sales and gross margin plans, look much higher than rates applied to revenue, simply because the base is smaller. And activity-based roles like SDRs are usually paid a fixed amount per outcome rather than a percentage, since they don't own the final deal value.
Real estate is changing: since the NAR settlement took effect on 17 August 2024, buyer and seller agent pay is negotiated separately, although total commissions have so far stayed in the mid-5% range.
If you design plans rather than earn them, the more useful question is what rate your OTE and quota imply. That's covered in How quota and OTE determine commission.
How to Calculate Commission Step By Step (The Real Payout Workflow)
In a real company, the multiplication is the easy part. Most errors and disputes happen before it, when someone decides which deals count and what they count for. Here is the six-step workflow behind every accurate payout.
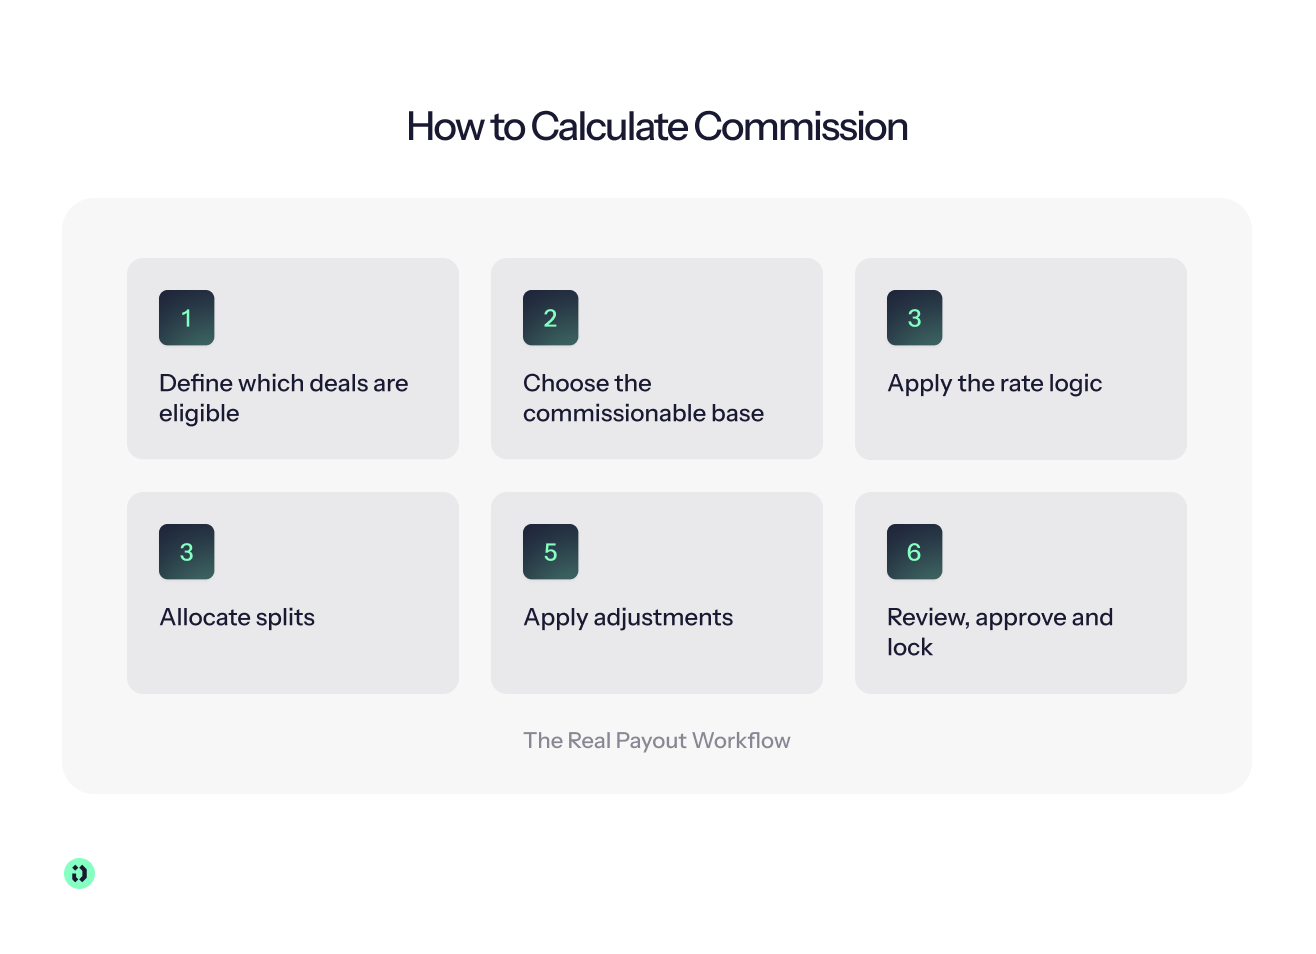
- Define which deals are eligible. A deal typically counts when it is closed-won within the period, has the right owner, sits in the right pipeline and deal type, and meets a clear eligibility trigger. That trigger is a plan decision: contract signed, customer onboarded or live, invoice sent, or invoice paid.
Common mistake: a deal counted in the wrong period, or paid despite a required CRM field being empty. - Choose the commissionable base. Decide whether commission applies to bookings, total contract value, first-year value, gross margin or collected cash.
Common mistake: paying on the full value of a three-year contract when the plan meant first-year value. - Apply the rate logic. Run each eligible deal through the plan: flat, tiered or accelerated, compared against quota. See commission structures.
Common mistake: applying a retroactive tier rate when the plan intended marginal tiers. - Allocate splits. When more than one person contributes, such as an AE, SDR or solutions engineer, divide the credit according to written rules. See adjustments.
Common mistake: splits that add up to more than 100% without anyone budgeting for it. - Apply adjustments. Add or deduct clawbacks, true-ups, draws, SPIFs and manual corrections. See adjustments.
Common mistake: netting a clawback silently into the total, so the rep can't see why their payout dropped. - Review, approve and lock. The manager reviews, finance approves and the payout is marked as paid. Once approved, lock it, so later CRM edits can't change an amount that has already been paid. Any correction goes on the next statement.
Common mistake: recalculating a closed period from a fresh CRM export and getting a different number.
Running Example: One AE, One Quarter
The AE is paid quarterly at 10% of eligible first-year value. The quarter runs from July to September.
- Eligible base: $30,000 + $20,000 = $50,000
- Commission at 10%: Deal A = $3,000, Deal B = $2,000
- Split: the SDR who sourced Deal A receives 20% of that deal's commission: $600 to the SDR, $2,400 to the AE
- AE commission before adjustments: $2,400 + $2,000 = $4,400
- Clawback: a Q2 deal worth $8,000 churned inside the 90-day clawback window. The AE was paid $800 on it, so −$800
- Final AE payout: $3,600. The SDR receives $600 for Deal A.
Tools like Driven apply eligibility rules like these as filters on CRM deal properties, so a deal only counts once its data is complete.
Commission Structures With Worked Examples
Each structure below has a formula, a checked example, when to use it and the pitfall to watch for.
Straight Commission
The rep earns only a percentage of sales, with no base salary.
- Formula: Commission = Sales × Rate
- Example: $75,000 × 6% = $4,500
- When to use: short sales cycles, independent or freelance reps.
- Pitfall: unstable income, and it can encourage aggressive selling.
Base Salary Plus Commission
A fixed salary with commission on top. The default for most B2B teams.
- Formula: Total pay = Base + (Sales × Rate)
- Example: $50,000 annual base + (5% × $400,000 = $20,000) = $70,000
- When to use: most salaried B2B sales roles.
- Pitfall: if the base is too high, the incentive gets diluted.
Commission On Sales Above Quota
Commission is paid only on sales beyond quota.
- Formula: Commission = (Sales − Quota) × Rate, when sales exceed quota
- Example: $100,000 quota, 12% above quota, $130,000 in sales: $30,000 × 12% = $3,600
- When to use: established teams with a high base.
- Pitfall: reps who miss quota earn nothing, which can demotivate them.
Tiered Commission: Marginal vs Retroactive Tiers
Tiered plans raise the rate as sales grow. But a tier table alone doesn't tell you what to pay. You also need to know whether each rate applies only to sales within its tier (marginal) or to all sales once the tier is reached (retroactive).
Same rep, same sales, both methods. Tiers: 5% up to $50,000, 8% from $50,000 to $100,000, 12% above $100,000. Sales: $120,000.
The retroactive plan pays $5,500 more, 62% above the marginal figure, for identical performance. It also creates a cliff: a rep at $99,000 earns $7,920 at 8%, while a rep at $100,000 earns $12,000 at 12%. That $1,000 of extra sales is worth $4,080, which tempts reps to time deals around thresholds. If your plan document doesn't say which method applies, fix that before the next payout.
Accelerators and Decelerators
Accelerators raise the rate above a threshold, usually quota.
Example: $100,000 quota, 10% up to quota and 15% above. The rep sells $130,000: ($100,000 × 10%) + ($30,000 × 15%) = $10,000 + $4,500 = $14,500.
Decelerators lower the rate when attainment falls below a threshold.
Example: below 70% attainment, all sales pay 5% instead of 10%. On a $100,000 quota, a rep who sells $60,000 (60% attainment) earns $60,000 × 5% = $3,000, compared with $6,000 on a flat 10%.
A stricter variant is a threshold: no commission at all until the rep reaches a minimum attainment, for example 50% of quota.
- Pitfall: harsh decelerators can lead reps to give up on a bad quarter and push deals into the next one (sandbagging).
Gross Margin Commission
Commission is based on profit rather than revenue.
- Formula: Commission = (Sale price − Cost) × Rate
Example: an $80,000 sale with $52,000 cost leaves $28,000 margin. $28,000 × 20% = $5,600.
Now see what a 10% discount does. The sale price drops to $72,000, margin falls to $20,000, and commission becomes $20,000 × 20% = $4,000, a 29% cut. On a 7% revenue plan, the same discount only moves commission from $5,600 to $5,040, a 10% cut. Margin-based plans discourage discounting far more strongly.
- When to use: products with variable margins, where discounting is a risk.
- Pitfall: reps need to see the cost data to trust the number.
Draw Against Commission
A recoverable draw is an advance paid during slow periods and repaid from future commission.
Example: a $2,000 monthly recoverable draw.
The rep ends up receiving exactly what they earned: $4,700. The draw only changes when the money arrives. With a non-recoverable draw, the $800 shortfall is forgiven, so the draw works like a guaranteed minimum.
Some guides simplify this by subtracting the draw from commission earned. That understates what the rep actually takes home, because the draw itself was already paid.
Residual (Recurring) Commission
The rep earns a percentage of each recurring payment for as long as the customer stays.
- Formula: Commission = Recurring payment × Rate
- Example: a $1,000 monthly account × 5% = $50 per month ($600 per year)
- When to use: subscription, insurance and account management roles.
- Pitfall: reps may sit on their book of business instead of hunting for new deals.
Different Rates for Different Deal Types
Many plans pay different rates by revenue type, for example 10% on new recurring revenue, 5% on renewals and 3% on one-time services. A deal with $40,000 of recurring revenue and $10,000 of services pays $4,000 + $300 = $4,300. This is usually set up with deal type, product or pipeline filters in the CRM.
How Quota and OTE Determine Commission
If you design commission plans, the question isn't “how is commission calculated?” but “what rate should I set?” The answer comes from OTE and quota. We'll follow one AE through the whole section.
The Set-Up
- OTE: $120,000 with a 50/50 pay mix, so a $60,000 base and $60,000 target variable pay.
- Annual quota: $600,000.
Pay mix is the split between base and variable pay at target. AEs typically sit close to 50/50: Bridge Group's 2024 data shows a median OTE of $190K at 53:47. Roles with less direct control over revenue carry more base, typically 65–70% for SDRs and 60–70% for account managers.
Derive the Rate From OTE
Rate = Target variable pay ÷ Quota
$60,000 ÷ $600,000 = 10%.
A quick sanity check is the quota-to-OTE ratio: $600,000 ÷ $120,000 = 5×. The median for SaaS AEs is about 4.2×. A ratio well above that suggests a demanding quota; well below suggests an expensive plan.
Attainment-Based Payout
Payout = Target variable × Attainment × Multiplier
- At 80% attainment ($480,000): $60,000 × 80% = $48,000
- At 120% attainment ($720,000), with a 1.5× accelerator above 100%: $60,000 + ($120,000 × 10% × 1.5) = $60,000 + $18,000 = $78,000
Reverse Calculation: Sales Needed to Hit OTE
Sales needed = Target variable pay ÷ Rate
$60,000 ÷ 10% = $600,000. That equals quota, by design: a well-built plan pays exactly OTE at 100% attainment.
Quarterly View
If commission is paid quarterly, the same plan becomes a $15,000 target variable against a $150,000 quarterly quota. The rate stays 10%.
Test Before You Roll Out
Before launching a new plan, run it against last year's CRM data and ask: what would each rep have earned? This quickly exposes plans that are too generous, quotas nobody could have hit, and tiers that only one rep would ever reach.
Adjustments That Break Simple Formulas
The formulas above assume every deal is final, owned by one person and priced in one currency. Real quarters don't work like that; these are the cases that make commission hard to calculate by hand.
Split Commissions
Percentage split. An 8% commission split 4-2-2 on a $50,000 deal:
Carve-out. The AE normally earns 10%. When a solutions engineer is involved, the SE takes 2% and the AE keeps 8%. On $50,000, the SE earns $1,000 and the AE earns $4,000, instead of $5,000 for the AE alone.
Splits vs overlays. With an overlay, both people are credited 100% of the deal, so the total commission cost is higher and needs its own budget line.
Clawbacks
Example: a $24,000 deal paid at 10% ($2,400) in Q1. The customer cancels inside the 90-day clawback window, so −$2,400 appears on the Q2 statement.
Pro-rated variant: if the customer churns after 6 months of a 12-month contract, half the commission is clawed back: −$1,200.
Define the clawback window and trigger in the plan, and always show the clawback as a separate line on the statement.
True-Ups
- Deal value drops after payout: $1,000 was paid on a $10,000 deal at 10%. The deal is renegotiated to $9,000, so the adjustment is −$100.
- Deal value rises after payout: the deal grows to $12,000, so the true-up is +$200.
Both go on the next statement. Don't reopen a payout that has already been paid.
Ramped Quotas and Mid-Period Changes
New hire example: the quarterly quota is $150,000. The rep joins with 2 of the 3 months left, so the prorated quota is $150,000 × 2/3 = $100,000. With a 50% ramp in their first quarter, the quota becomes $50,000.
When accounts move between reps, decide whether credit goes to the deal owner at close date or is split by time, and write that rule into the plan.
Multi-Currency Deals
Example: a €50,000 deal, with commission paid in USD at 10%.
- Rate locked at close date, 1.10: $55,000, so commission is $5,500
- Monthly average rate, 1.08: $54,000, so commission is $5,400
Locking the rate at close date is simple and matches common CRM practice. A period average reduces exposure to daily swings. Some finance teams apply a slightly conservative rate as a buffer; a CFO at one digital agency described doing exactly that. Whichever you pick, write the rule into the plan.
Double-Payment Risk
A deal is closed-won and paid in Q1. In Q2 it was closed-lost, then in Q3 it reopened and won again. A spreadsheet that simply filters “closed-won in period” pays it twice.
The fix: track paid deals by deal ID, and lock payouts once they're approved.
How to Calculate Sales Commission in Excel or Google Sheets
If you want to calculate commission yourself, you can build a simple calculator in Excel or Google Sheets using the formulas in this guide. The basic setup works for straightforward commission plans, while the same sheet can also handle quotas, accelerators, and tiered commission structures. You can copy the formulas below into your own spreadsheet or use our free commission sheet template.
Sheet Setup
Start by giving each input its own column. This keeps the calculation easy to follow and makes it simpler to change a rep's sales, commission rate, base salary, or quota without rewriting the formulas.
Use the following columns:
- Column A: rep
- Column B: sales
- Column C: rate
- Column D: base salary
- Column E: quota
- Column I: accelerated rate (optional)
If you're using a tiered commission structure, add the tier thresholds and rates to columns F–H. In this example, the first $50,000 of sales earns 5%, sales from $50,000 to $100,000 earn 8%, and sales above $100,000 earn 12%.
Tier table in F2:H4:
This gives you a reusable commission calculator rather than a one-off calculation. Change the sales figure in column B, and the formulas can calculate the corresponding commission automatically.
To calculate commission rate, start by identifying the percentage that applies to each eligible sale. Once you have the rate, you can use the basic formula below to calculate the commission amount.
Formulas
The formulas below cover the main sales compensation calculations in this guide. We've checked the tiered examples against sales of $120,000 in B2, so you can compare the results with the worked examples above.
There are two important things to understand when using these formulas. First, the retroactive formulas apply the highest tier reached to all sales, while the marginal formulas calculate commission separately within each tier. In this example, $120,000 in sales produces $14,400 under the retroactive method but $8,900 under the marginal method. Make sure your sales compensation plan specifies which calculation method applies before you build the formula.
Second, be consistent about the boundaries between tiers. Using >= in the IF formula puts exactly $100,000 into the 12% tier, which matches how XLOOKUP and VLOOKUP behave in the formulas above. Mixing > and >= can produce different results at the thresholds.
The SUMPRODUCT formula uses column H to calculate the increase in rate at each tier: 5% for the first tier, then an additional 3%, followed by an additional 4%. It produces the same $8,900 result as the more readable marginal formula and can be extended to additional tiers. If you're using Google Sheets, XLOOKUP, VLOOKUP, SUMPRODUCT, MIN, and MAX work in the same way.
Where Spreadsheets Hit Their Limits
A spreadsheet is a perfectly reasonable place to start, particularly for a small sales force with a straightforward plan. The problem is that the manual work increases as you add more sales reps, more plans, and more complicated commission rules.
Every payout cycle means exporting fresh CRM data, checking formulas, reconciling changes, and making sure everyone is working from the same version. A file called “commissions_final_v3_FINAL.xlsx” might be funny, but it also points to a real problem: spreadsheets don't give you a reliable audit trail of who changed a formula or when.
There is also a timing problem. If the calculation only happens after someone has exported and processed the data, reps may not see their current sales performance or expected commission until the payout statement arrives. That makes it harder for reps to understand what they're earning, and harder for sales managers to spot problems before the end of the period.
For a small team and a simple plan, that may be manageable. As the number of reps and complex commission structures grows, however, the risk of manual errors, version conflicts, and delayed visibility grows with it.
From Spreadsheet to Automated: Calculating Commission from CRM Data
Manual commission calculation doesn't fail because the math is hard. It fails because the calculation happens too late and too far from the data. Payouts can be calculated weeks after deals close; one finance lead we spoke with described a gap of roughly 45 days between a deal closing and the rep seeing the payout. When reps can't check how their commission was calculated, trust suffers, disputes pile up, and someone has to spend days every cycle reconciling CRM exports.
Calculating commission directly from CRM data removes much of that manual work. With Driven, your CRM becomes the source of truth, with deals, owners, amounts and stages syncing directly from HubSpot or Salesforce. Eligibility rules can then be applied automatically to deal properties, so a deal only enters the calculation when its data is complete. Because commission depends on accurate CRM data, this also gives sales teams a stronger incentive to maintain CRM hygiene.
The plan logic itself stays transparent and easy to audit. Driven supports tiers, accelerators, splits and clawbacks through readable, Excel-like formulas, while its AI assistant can draft a plan from a plain-language description or an existing plan document. A person reviews and publishes the plan, and the calculation remains deterministic rather than becoming a black box. The plan designer can also derive each rep's applied percentage from their variable pay and quota, as shown earlier in this guide.
Once the plan is live, reps can see what they've earned and what their open pipeline could pay while the period is still running. They can also see why a particular deal generated a specific commission, including the rule, rate and stage behind the calculation. Payouts move through a clear draft, approved and paid workflow, with approved payouts locked to prevent double payments. Any changes after approval can flow through as clawbacks or true-ups on the next statement, while updates and notifications can reach teams through Slack, email and HubSpot.
What Teams See After Switching
The impact of moving away from manual commission calculations can be significant. Aikido Security cut quarterly commission processing from three days to three hours and went live across more than 120 reps in six regions within a week of connecting HubSpot. Bizzy saved around four hours per rep each month and cut commission disputes by roughly 90%.
Other Driven customers report similar improvements. One reviewer says they are “winning 8 hours back every month” after connecting HubSpot, while another says they were “up and running in less than half an hour.” A third describes commission calculations that once took hours now happening “in seconds.”
One customer sums up the value particularly well: “The ‘why did I earn this?’ explanation feature has been a game changer for trust. Disputes used to eat up time every month-end. Now they're almost gone.”
If your sales team is still calculating commission manually, the problem isn't necessarily the formula. It's the process around it. Connecting your commission plan directly to your CRM can give reps faster visibility into their earnings, give finance a more reliable calculation process, and give sales managers a clearer view of performance throughout the period.
Connect your HubSpot and see your first payouts calculated automatically. Start for free or book a demo to find out how Driven can help you.



See your comp plan, fully built in minutes

Frequently Asked Questions About Calculating Sales Commission
About the author





A sales compensation plan defines how your sales team gets paid: a fixed base salary, variable pay like commissions and bonuses, and a quota that decides how much of that variable pay a rep actually earns. Base salary plus target variable pay makes up a rep's on-target earnings (OTE).
Sales compensation plans do more than pay people; they shape behavior, drive revenue, and define culture. Get the plan right, and your team is aligned, motivated, and chasing the numbers that actually matter. Get it wrong, and you'll spend every month-end on disputes, recalculations, and reps who no longer trust their payslip.
This guide covers the core components, the main plan types, and a 10-step process to build your own, followed by three sales compensation plan examples. Jump to the examples. Everything here draws on Driven's work with finance, RevOps, and sales compensation leaders who run these plans every single month.

Sales commission software calculates, tracks and explains commissions from your CRM data, so nobody rebuilds a spreadsheet every month. The 9 best tools in 2026:
- Driven: best AI commission agent for HubSpot and Salesforce teams that want to go live in days
- QuotaPath: best for growing teams that want published pricing and broad CRM coverage
- CaptivateIQ: best for mid-market teams with complex, frequently changing plans
- Salesforce Spiff: best for companies that run on Salesforce
- Qobra: best for European RevOps teams that want no-code plans and AI agents
- Xactly Incent: best for large enterprises that also need planning and forecasting
- Performio: best for complex crediting across many data sources and regions
- Sales Cookie: best for small businesses that want month-to-month contracts
- QCommission: best for finance-led teams on QuickBooks or needing on-premise deployment
Choose based on three things: your CRM, how many reps you pay, and how complex your plan is.

TL;DR: Salesforce stores every field commissions depend on, but core Sales Cloud doesn't calculate, explain or protect payouts. Teams close that gap in one of five ways: native formula fields, a custom build, Salesforce's native ICM (Spiff), a vibe-coded tool, or a third-party commission tool. A flat rate and a few reps can stay native. Tiers, accelerators, splits and frequent plan changes point to a dedicated tool, and to an agentic platform like Driven if you want the plan designed, explained and maintained for you.
It's not uncommon for teams in 2026 to still run sales commissions on spreadsheets. The deal data lives in Salesforce, the rates live in a Google Sheet someone built three finance leads ago, and the payouts get reconciled by hand at the end of every quarter. When a rep asks why their number looks different, no one can fully explain it. When finance needs an accrual, someone exports a report and rebuilds it in Excel. The process is time-consuming, error-prone, and actively eroding rep trust. It's hard to keep a sales team motivated when reps can't trust their own paycheck.
Teams that outgrow the spreadsheet usually reach for formula fields, a custom build, or a paid add-on. But tools for managing sales incentives are now moving from rules engines you configure to agents that work alongside you. Gartner predicts that 40% of enterprise applications will feature task-specific AI agents by the end of 2026, up from less than 5% in 2025. They also say that 60% of B2B seller work will be executed through conversational interfaces by 2028.
This guide breaks down five ways to track Salesforce commissions, including what each approach does well, where it breaks, and how to choose.