Free Commission Sheet Template: 8 Sales Commission Structures in One Workbook
TL;DR
Most commission plans fail because nobody modelled the numbers before rolling them out. A rate that looks generous on a slide turns into a payout you can't afford at 130% attainment, or an accelerator so flat that your best sales reps stop pushing the moment they hit quota.
So we collected the eight most common sales commission structures into a single free commission sheet template. It is one workbook with a commission spreadsheet for each structure, each with live formulas and a filled-in example. Change a rate, a quota, or a revenue number and every payout updates instantly, so you can compare sales commissions across models in one place.
Open the template in Google Sheets or start for free and let Driven build the plan for you.

What Is a Commission Sheet Template?
A commission sheet template is a pre-built spreadsheet that organizes sales data and calculates compensation for each sales rep. It outlines fixed and variable pay, applies commission rates to sales, and accommodates different commission structures. That cuts calculation errors and makes compensation plans easier to scale. You will also see it called a commission spreadsheet, and it is the fastest way to test how a commission structure pays out before it reaches your sales team.
What a Commission Sheet Includes
Whatever the structure, the key elements of a commission sheet are the same:
- Sales rep name: who earned the commission.
- Deal or revenue data: each closed deal and the total sales for the time frame.
- Commission rate: the percentage, or the tiers, applied to those sales.
- Quota and attainment: how far each sales rep got against target.
- Base salary: the fixed pay, if the plan includes it.
- Commission basis: whether rates apply to gross sales, net profit, or collected revenue.
- Adjustments: refunds, cancellations, or deductions that reduce a payout.
- Payout schedule: when total commissions are calculated and paid, such as monthly or quarterly.
Commission Sheet Template vs. Commission Plan
A commission plan is the set of rules: who earns what, on which deals, and when. A commission sheet template is where you model those rules and calculate the numbers. Write the plan first, then use the template to check that it is both motivating and affordable.
Which Commission Structure Should You Use?
Find the situation closest to yours, then jump to that tab below.
New to comp design? Our guide to sales compensation structure types explains how to choose between them.
How to Use the Commission Spreadsheet Template
Open the file and start on the "Start Here" tab, then pick the tab that matches your plan. Edit only the shaded cells (blue text on a yellow fill), overwrite the worked example row with your own sales reps, and leave the black formulas alone: they automatically calculate every payout as you type. Set your payout schedule in the plan itself, so everyone knows when commissions are calculated.
Prefer Microsoft Excel? You do not need a separate file. Open the template in Google Sheets, go to File > Download > Microsoft Excel (.xlsx), and open the downloaded spreadsheet in Excel. The formulas and tabs come with it.
Model a few scenarios before you commit: your top sales rep at a blowout number and a ramping rep at a slow start. A commission spreadsheet is the place to find a plan's failure modes, where they cost nothing. For benchmarks, see our sales compensation statistics guide, and for the decisions behind the numbers, our guide on how to build a sales compensation plan.
The 8 Commission Structures in the Template
The workbook covers the eight sales commission structures most teams use:
- Flat-Rate Commission
- Base Salary + Commission (OTE)
- Tiered Commission with Accelerators
- Draw Against Commission
- Gross-Margin Commission
- Deal-Level Modifiers
- Residual Commission
- Territory Volume Commission
1. Flat-Rate Commission
The simplest structure there is: one commission rate applied to every closed deal. In the template, a sales rep who closes $120,000 at an 8% rate earns $9,600. There are no tiers or thresholds, and nobody needs a spreadsheet to follow the math.
Formula: Commission = Revenue closed × Commission rate
When to use it: This revenue-based plan suits uniform deals and predictable margins, such as inbound or SDR-sourced pipelines. It treats every dollar the same, so it does little to push overperformance.
Why replace the simple commission spreadsheet with Driven: A simple sheet is only simple until the revenue number has to be right. Someone still exports closed deals from the CRM, pastes them in, and answers every "is this correct?" question. Driven syncs closed deals from your CRM data, calculates each payout automatically, and shows every sales rep which deals made up their commission.
2. Base Salary + Commission (OTE)
Here you start from On-Target Earnings (OTE), the total a sales rep makes at 100% of quota, and split it into a base salary and variable pay tied to performance. In the template, a $120,000 OTE with a 40% variable share becomes $72,000 base and $48,000 variable. With a $1,000,000 quota, that works out to 4.8% on every dollar closed. At $850,000 (85% attainment), the rep earns $40,800 in commission and $112,800 in total. At exactly 100% attainment, total pay equals OTE.
Formula:
- Base salary = OTE × (1 − Variable share)
- Commission per $ of quota = (OTE × Variable share) ÷ Quota
- Total comp = Base salary + (Revenue closed × Commission per $ of quota)
When to use it: This is the default for most full-cycle sales roles: the base gives stability, the variable keeps reps motivated. A 50/50 split says "this role is all about the close," while 70/30 suits longer cycles.
Why replace the base + commission spreadsheet with Driven: Keeping OTE math in a commission spreadsheet gets tedious as soon as quotas move and sales reps ask where they stand. In Driven, every rep sees their quota, attainment, and earnings live, and a quota change is one update to the plan instead of formulas rebuilt for every rep.
3. Tiered Commission with Accelerators
This is the structure most modern sales teams land on, because it works as a way of rewarding overperformance. The commission rate climbs as a rep moves through bands of quota attainment. In the template: 6% up to 100% of quota, 9% between 100% and 150%, and 12% above 150%.
The tiers are marginal: each dollar is paid at the rate for the band it falls into, not one rate on the whole total. A rep at 165% of a $100,000 quota earns 6% on the first $100,000, 9% on the next $50,000, and 12% on the final $15,000. That is $12,300. Applying the top rate to all $165,000 would pay $19,800, an overpayment of $7,500.
Formula (marginal):
- Tier 1 pay = MIN(Revenue, Quota) × Rate 1
- Tier 2 pay = MAX(0, MIN(Revenue, 1.5 × Quota) − Quota) × Rate 2
- Tier 3 pay = MAX(0, Revenue − 1.5 × Quota) × Rate 3
Total = Tier 1 + Tier 2 + Tier 3.
When to use it: When you want sales reps to keep selling after they hit target. Model top performers at their best month, not their average one, so costs stay predictable.
Why replace the tiered commission spreadsheet with Driven: Tiered sheets are the easiest to get subtly wrong: one misplaced range and a rep is overpaid or underpaid. In Driven, you describe the tiers in plain language and the agent builds the formula, written in Excel-style syntax so you can check it yourself. Before you publish, you can test the plan against historical payouts to see what an exceptional quarter would cost.
4. Draw Against Commission
A draw is a guaranteed advance a rep receives each period, later recovered from the commission they earn. It solves a real problem: commission-only income is brutal during ramp or in businesses with long, lumpy sales cycles.
The template models a recoverable draw. In the example, a rep is advanced $4,000 a month at a 10% commission rate. In January they close $22,000 and earn $2,200, so $1,800 is added to the balance they owe against future commissions. When commission later exceeds the draw, the excess first repays that balance, and only then is paid out. By May, the balance is cleared.
Formula:
- Commission earned = Revenue × Commission rate
- Payout = Draw + MAX(0, Commission earned − Draw − Prior balance)
- New balance owed = MAX(0, Prior balance + Draw − Commission earned)
When to use it: During onboarding, a new territory launch, or any role where building a pipeline takes months. State in writing whether a draw is recoverable; it is a common source of comp disputes.
Why replace the draw commission spreadsheet with Driven: The running balance is what makes a draw spreadsheet fragile: miss one month and every later number is off. Driven calculates each payout from your CRM data and shows how every number was built, so a sales rep can see exactly why they received a certain amount.
5. Gross-Margin Commission
Instead of paying on revenue, you pay on profit: the gross margin left after the cost of the sale. In the template, a $90,000 deal that costs $54,000 to deliver produces $36,000 of margin and, at a 20% rate, $7,200 of commission.
Formula:
- Gross margin = Revenue − Cost (COGS)
- Commission = Gross margin × Rate
When to use it: When margin matters more than top-line revenue. Because pay follows profit, a rep who discounts to win a high-value deal reduces their own commission. It needs reliable cost figures per deal.
Why replace the gross-margin commission spreadsheet with Driven: Margin-based sheets depend on cost figures that someone has to type in for every deal, and they are usually the first thing to go stale. If the cost lives on the deal in your CRM, Driven can read it and calculate commission automatically.
6. Deal-Level Modifiers
The structures above set a rate at the plan level. This one sets different commission rates deal by deal, based on the characteristics of each deal. Not every deal is worth the same to the business, so not every deal pays the same rate.
The template models two common modifiers, so commission rates based on contract size and deal source adjust automatically. Deals above a size threshold earn a bonus, which rewards high-value deals. Outbound deals earn a higher rate than inbound ones, because the rep built them from scratch. For example, a $180,000 outbound deal on a large contract combines a 5% base, a 2% large-deal bonus, and a 3% outbound adjustment for a 10% effective rate. That is an $18,000 payout.
Formula:
- Effective rate = Base rate + Large-deal bonus (if contract size > threshold) + Source adjustment (inbound or outbound)
- Commission = Deal value × Effective rate
When to use it: When a single rate would reward the wrong behavior, like paying the same for a hard-won outbound deal as for an inbound renewal. Every modifier is one more rule to trust, so add them deliberately.
Why replace the deal-level commission spreadsheet with Driven: Every modifier is another column someone has to remember to fill in correctly. Driven applies modifiers as rules on deal properties from your CRM, such as source or deal size, so the right rate is used on every deal without anyone flagging it by hand.
7. Residual Commission
With residual commissions, a rep earns an ongoing percentage of the recurring revenue from their accounts for as long as those customers keep paying. In the template, an $8,000-a-month account at a 5% residual rate pays the rep $400 every month it renews, or $4,800 across a year.
Formula:
- Commission per period = Recurring revenue × Residual rate
- Annualized commission = Commission per period × Periods per year
When to use it: SaaS, subscriptions, and any model built on renewals. It rewards sales reps for landing customers who stay, but most teams pair it with a new-business component to avoid motivation drift.
Why replace the residual commission spreadsheet with Driven: Residual sheets mean recalculating every account, every period, and checking which ones are still active. Driven pulls revenue from your CRM each period and calculates every payout automatically.
8. Territory Volume Commission
Territory volume rewards the total sales volume generated within a region, then splits the payout across the sales reps who cover it. In the template, a territory that sells $1,725,000 at a 4% rate produces $69,000 in commission. Shared across three reps, that is $23,000 each. The tab also flags whether the region met its quota.
Formula:
- Territory commission = Actual territory sales × Commission rate
- Commission per rep = Territory commission ÷ Number of reps in the territory
When to use it: When you are driving market penetration in specific regions and want a team pulling together. Individual sales effort gets diluted, so it works best alongside an individual metric.
Why replace the territory commission spreadsheet with Driven: Territory splits break the moment a rep changes region or a team is reshuffled. Driven calculates from the assignments and deal data in your CRM, so a territory change does not mean rebuilding the split.
Automate Commission Calculations: From Spreadsheet to Autopilot with Driven
A commission spreadsheet is perfect for designing and pressure-testing a plan. It is a lot less fun once the plan is live: Excel spreadsheets that need maintaining across dozens of sales reps, CRM data reconciled by hand every month, "why is my number wrong?" questions, and a rebuild the moment leadership tweaks the quota. Templates reduce errors, but they still rely on manual work, and manual errors creep in as the sales team grows.
That is the problem Driven was built for. Driven is the AI-powered sales commission platform that takes the plan you modelled in this template and runs it for you. Like other dynamic platforms, it pulls data directly from your CRM, then automatically calculates every payout, explains each number to your sales reps, and keeps the plan up to date without anyone maintaining formulas by hand.
What Changes When You Move from the Sheet to Driven
Your Template Is Already Your Starting Point
You do not have to start from scratch. If you have already modelled your plan in this workbook, you can upload it to Driven and the agent structures it and validates it against historical payouts. That turns weeks of manual setup into hours. Nothing goes live without human sign-off: the agent proposes, and you confirm.
Built for the Whole Team
- For finance teams and RevOps: Payouts are generated automatically, reviewed in one place, and approved before anyone is paid. It saves time every month and ends calculation errors.
- For sales leaders: Proactive alerts show where sales performance is strong and where the plan needs fixing.
- For sales reps: A clear view of what they have earned and exactly how each payout was calculated.
"We went from spending 3 days on commission calculations to getting it done in 3 hours. Driven gave our reps real-time visibility into their earnings, which was a game-changer for our team." – Thijs Janse, SVP Revenue, Aikido Security
Start with the template. When you are ready to stop maintaining it by hand, see what running the same plan on autopilot looks like.



See your comp plan, fully built in minutes

Frequently Asked Questions
About the author



- What they do: AI tools for sales operations take repetitive work off your team, keep CRM data clean and surface insights across planning, routing, forecasting and pay.
- The main lesson: match the kind of AI to the job. AI drafts, explains and flags; fixed rules calculate anything involving money or ownership; a human signs off.
- Best AI tools for sales ops: Driven (compensation), Fullcast (territory and quota planning), Clay (data enrichment), LeanData (lead routing), Gong (pipeline and forecasting).
- What's at stake: real teams lose from one or two days to two weeks per quarter on manual work.
- How to choose: start from your CRM, fix your source of truth, pick the one bottleneck that hurts most and test edge cases in a pilot.

- Sales commission automation is the process of using rules, data, and automated systems to calculate, track, approve, and report sales commissions with less manual effort.
- You can automate sales commissions with spreadsheets, build a custom system, or use dedicated sales commission software, depending on your team's size, commission structures, and business needs.
- A useful rule of thumb is: AI can help draft and explain plans, rules should calculate payouts, and humans should approve them.
- To get started, identify your source of truth, clean your CRM and sales data, document your commission rules, and then choose the automation approach that fits your commission process.
- Aikido Security used Driven to cut its commission processing time from 3 days to 3 hours, while giving 120+ sales reps real-time visibility into their earnings.
Under ASC 606, the revenue recognition standard, and its cost subtopic, ASC 340-40, sales commissions that are incremental costs of obtaining a contract are no longer expensed when paid. They are recorded as a deferred commission asset and amortized as the company delivers the service, which can be longer than the initial contract term if renewals are expected. A practical expedient lets you expense commissions as incurred when the amortization period is one year or less, but it rarely fits multi-year SaaS contracts.
Fixed salaries and company-wide bonuses are not capitalized, while SPIFFs and bonuses tied to specific deals usually are. ASC 606 does not dictate how to design your sales compensation plan, but the plan you choose determines how much accounting work you create. Clear rules on new vs. renewal commissions, clawbacks and other sales incentives keep it clean, and a platform like Driven can automate the schedules and keep them audit-ready.

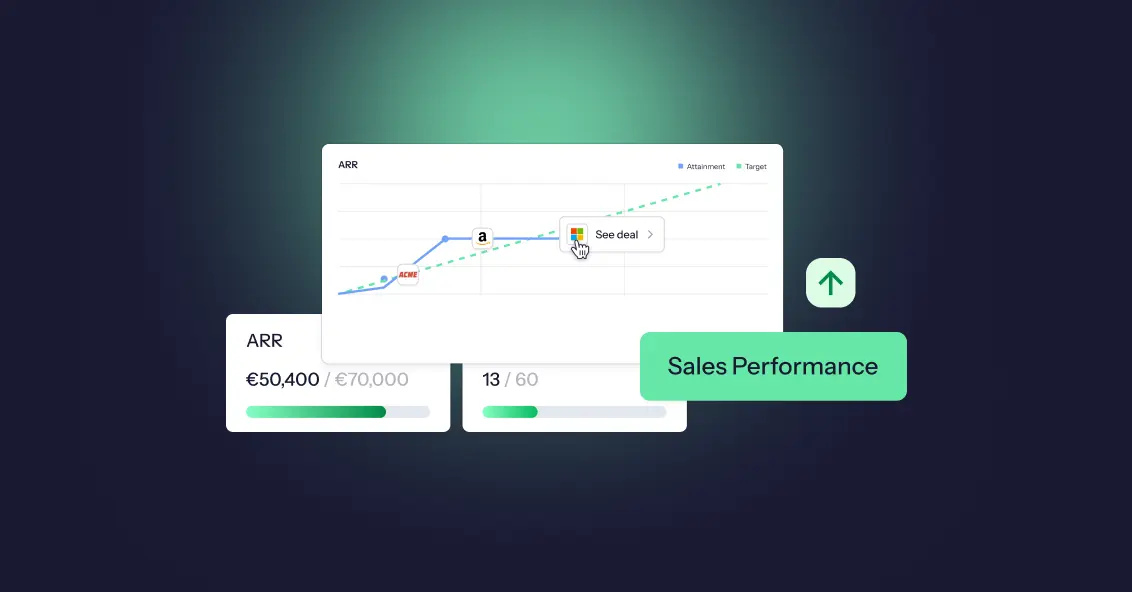
Sales performance analysis is the process of examining sales data to understand what is driving results, what is holding them back, and what to change next. It differs from reporting, which only says what happened, and the ongoing practice and technology behind it is called sales analytics.
A good sales analysis starts with a clear question, tracks a handful of key sales metrics (win rate, conversion rate, average deal size, sales cycle length, quota attainment, pipeline coverage and cost of sales), and looks at the data through five lenses: time, rep, territory, customer segment and lead source. The practical process has seven steps: ask a question, collect the sales data, clean it, set a baseline, identify trends through the lenses, diagnose the root cause, and act and monitor.
To evaluate individual sales reps, use a balanced scorecard of outcomes, activity and quality, and look at how attainment is distributed across the team, not just the average. Because compensation shapes behavior, it helps to analyze pay against performance too.
Driven acts as the data layer that connects your CRM and commission data, so you can query it in natural language and build the dashboards each person needs.
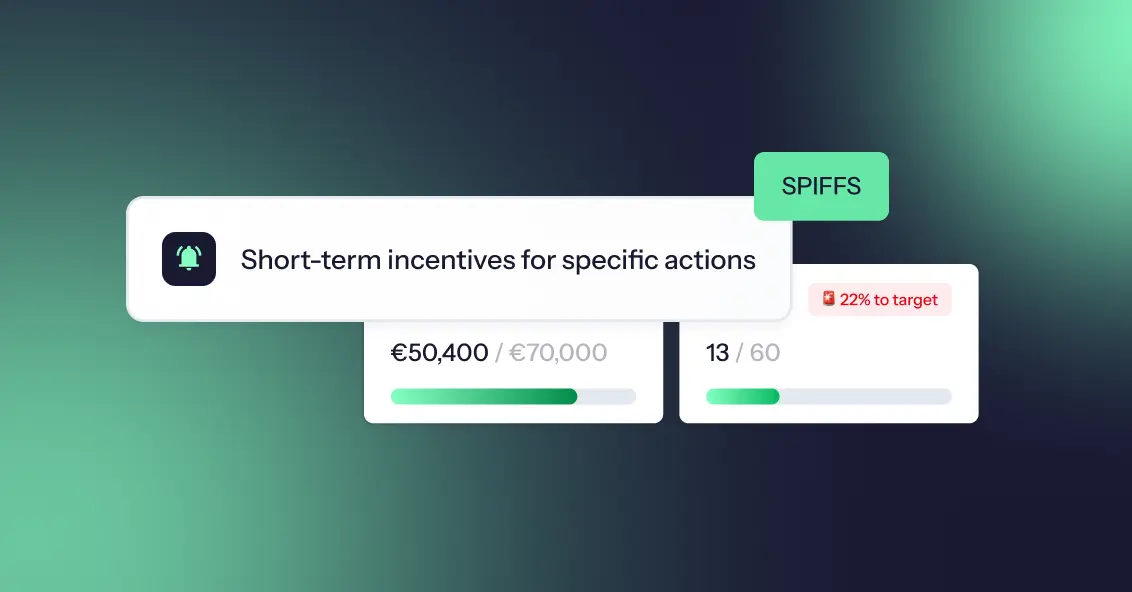
A SPIF (Sales Performance Incentive Fund, also spelled SPIFF) is a short-term sales incentive that rewards sales reps for a specific goal within a defined period, such as selling a specific product or hitting a revenue milestone. It sits on top of sales commissions and is usually paid out fast, which is what makes it effective.
Every SPIFF works the same way: set a goal, define the reward, set a timeframe, track performance, and pay out quickly. SPIFFs come in several types, including individual, team, product, tiered, activity-based, and vendor-funded, and sales teams use them to focus attention, create urgency, and boost sales. To build an effective SPIFF program, define the objective, write simple rules, set a budget, and communicate clearly. To measure one, compare results to a baseline and check the cost per extra sale. The most common mistakes are overcomplicated rules, running SPIFFs too often, and rewards too small to matter. Tools like Driven automate the tracking and payouts, so none of this lives in a spreadsheet.
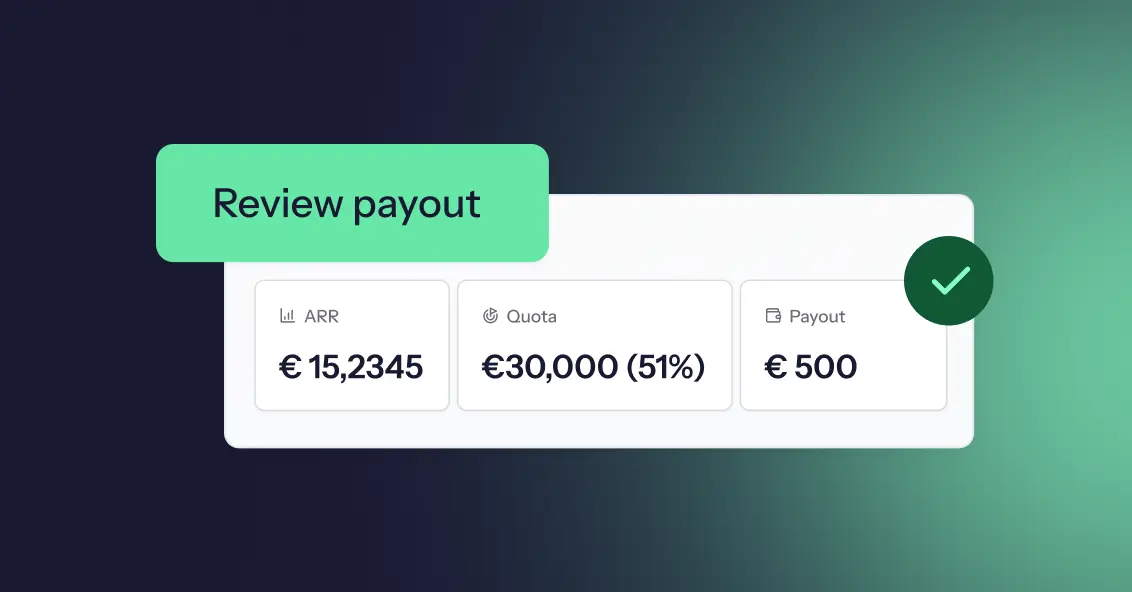
Incentive pay is variable pay that rewards employees for results, paid on top of base pay and earned again in each period. It counts toward total earnings and is generally taxable, but it is not part of the fixed salary.
Common types include commission, performance bonuses, team incentives, gainsharing, profit sharing, spot awards, non-monetary incentives, and long-term incentives like stock options. Unlike a bonus, which rewards past results, or merit pay, which is a permanent raise, incentive pay is agreed in advance and drives future performance.
It is calculated as a performance result multiplied by an incentive rate, using flat, threshold, tiered, or target-based structures. To make it work, set clear objectives, use a few meaningful metrics, set realistic targets, and pay out accurately and on time with transparent statements.
The main risks are gaming, sandbagging, short-term focus, and perceived unfairness, and clear data and automation help catch them early.
A sales compensation plan defines how your sales team gets paid: a fixed base salary, variable pay like commissions and bonuses, and a quota that decides how much of that variable pay a rep actually earns. Base salary plus target variable pay makes up a rep's on-target earnings (OTE).
Sales compensation plans do more than pay people; they shape behavior, drive revenue, and define culture. Get the plan right, and your team is aligned, motivated, and chasing the numbers that actually matter. Get it wrong, and you'll spend every month-end on disputes, recalculations, and reps who no longer trust their payslip.
This guide covers the core components, the main plan types, and a 10-step process to build your own, followed by three sales compensation plan examples. Jump to the examples. Everything here draws on Driven's work with finance, RevOps, and sales compensation leaders who run these plans every single month.
Sales commission software calculates, tracks and explains commissions from your CRM data, so nobody rebuilds a spreadsheet every month. The 9 best tools in 2026:
- Driven: best AI commission agent for HubSpot and Salesforce teams that want to go live in days
- QuotaPath: best for growing teams that want published pricing and broad CRM coverage
- CaptivateIQ: best for mid-market teams with complex, frequently changing plans
- Salesforce Spiff: best for companies that run on Salesforce
- Qobra: best for European RevOps teams that want no-code plans and AI agents
- Xactly Incent: best for large enterprises that also need planning and forecasting
- Performio: best for complex crediting across many data sources and regions
- Sales Cookie: best for small businesses that want month-to-month contracts
- QCommission: best for finance-led teams on QuickBooks or needing on-premise deployment
Choose based on three things: your CRM, how many reps you pay, and how complex your plan is.

TL;DR: Salesforce stores every field commissions depend on, but core Sales Cloud doesn't calculate, explain or protect payouts. Teams close that gap in one of five ways: native formula fields, a custom build, Salesforce's native ICM (Spiff), a vibe-coded tool, or a third-party commission tool. A flat rate and a few reps can stay native. Tiers, accelerators, splits and frequent plan changes point to a dedicated tool, and to an agentic platform like Driven if you want the plan designed, explained and maintained for you.
It's not uncommon for teams in 2026 to still run sales commissions on spreadsheets. The deal data lives in Salesforce, the rates live in a Google Sheet someone built three finance leads ago, and the payouts get reconciled by hand at the end of every quarter. When a rep asks why their number looks different, no one can fully explain it. When finance needs an accrual, someone exports a report and rebuilds it in Excel. The process is time-consuming, error-prone, and actively eroding rep trust. It's hard to keep a sales team motivated when reps can't trust their own paycheck.
Teams that outgrow the spreadsheet usually reach for formula fields, a custom build, or a paid add-on. But tools for managing sales incentives are now moving from rules engines you configure to agents that work alongside you. Gartner predicts that 40% of enterprise applications will feature task-specific AI agents by the end of 2026, up from less than 5% in 2025. They also say that 60% of B2B seller work will be executed through conversational interfaces by 2028.
This guide breaks down five ways to track Salesforce commissions, including what each approach does well, where it breaks, and how to choose.
To calculate sales commission, multiply the commissionable sales amount by the commission rate. A $40,000 sale at 8% earns $3,200. Base-plus-commission plans add that figure to salary, and tiered plans apply each tier's rate only to the sales inside it. The hard part is agreeing which deals count and what the rate applies to.
Three core formulas cover almost every plan. Straight commission is Commission = Sales × Rate. Base plus commission is Total pay = Base salary + (Sales × Rate). Tiered commission adds up each tier separately: (Tier 1 sales × Tier 1 rate) + (Tier 2 sales × Tier 2 rate), and so on for every tier the rep reaches.
This guide shows why most payout errors come from deciding which deals count rather than from the calculation itself. It explains why tiered plans can pay very different amounts depending on whether tiers are marginal or retroactive, and it covers why payouts should be locked once approved, so later CRM changes don't alter what has already been paid.

Ask a sales rep what's driving their next paycheck, and you'll often hear all three words used interchangeably: SPIFF, bonus, and commission. They get lumped together as "extra money for selling," but they're not the same thing, and treating them like they are leads to confused reps, inconsistent payouts, and comp plans nobody can actually explain.
A SPIFF is a short-term, targeted incentive. A bonus is a lump-sum reward tied to hitting a broader goal. A commission is the ongoing, formula-based pay tied directly to sales, the core of most sales comp plans, not an add-on to it.
This guide breaks down what each one actually means, when companies use them, how they're calculated, and how they stack together so you can build a comp plan where every payout has a clear reason behind it.

New sales hires often get offered a "draw" against commission, and most sign the offer letter without knowing there are two very different types. That gap in understanding can mean thousands of dollars either staying in a rep's pocket or getting clawed back months later.
A draw is essentially an advance on future commission, designed to give reps steady income while they ramp up pipeline and close their first deals. But whether that advance is recoverable or non-recoverable determines something much bigger: whether it ever has to be paid back.
This guide breaks down what each draw type means, how they're calculated, when companies typically use each one, and the mistakes that turn a helpful ramp tool into a trust problem between reps and the company that hired them.
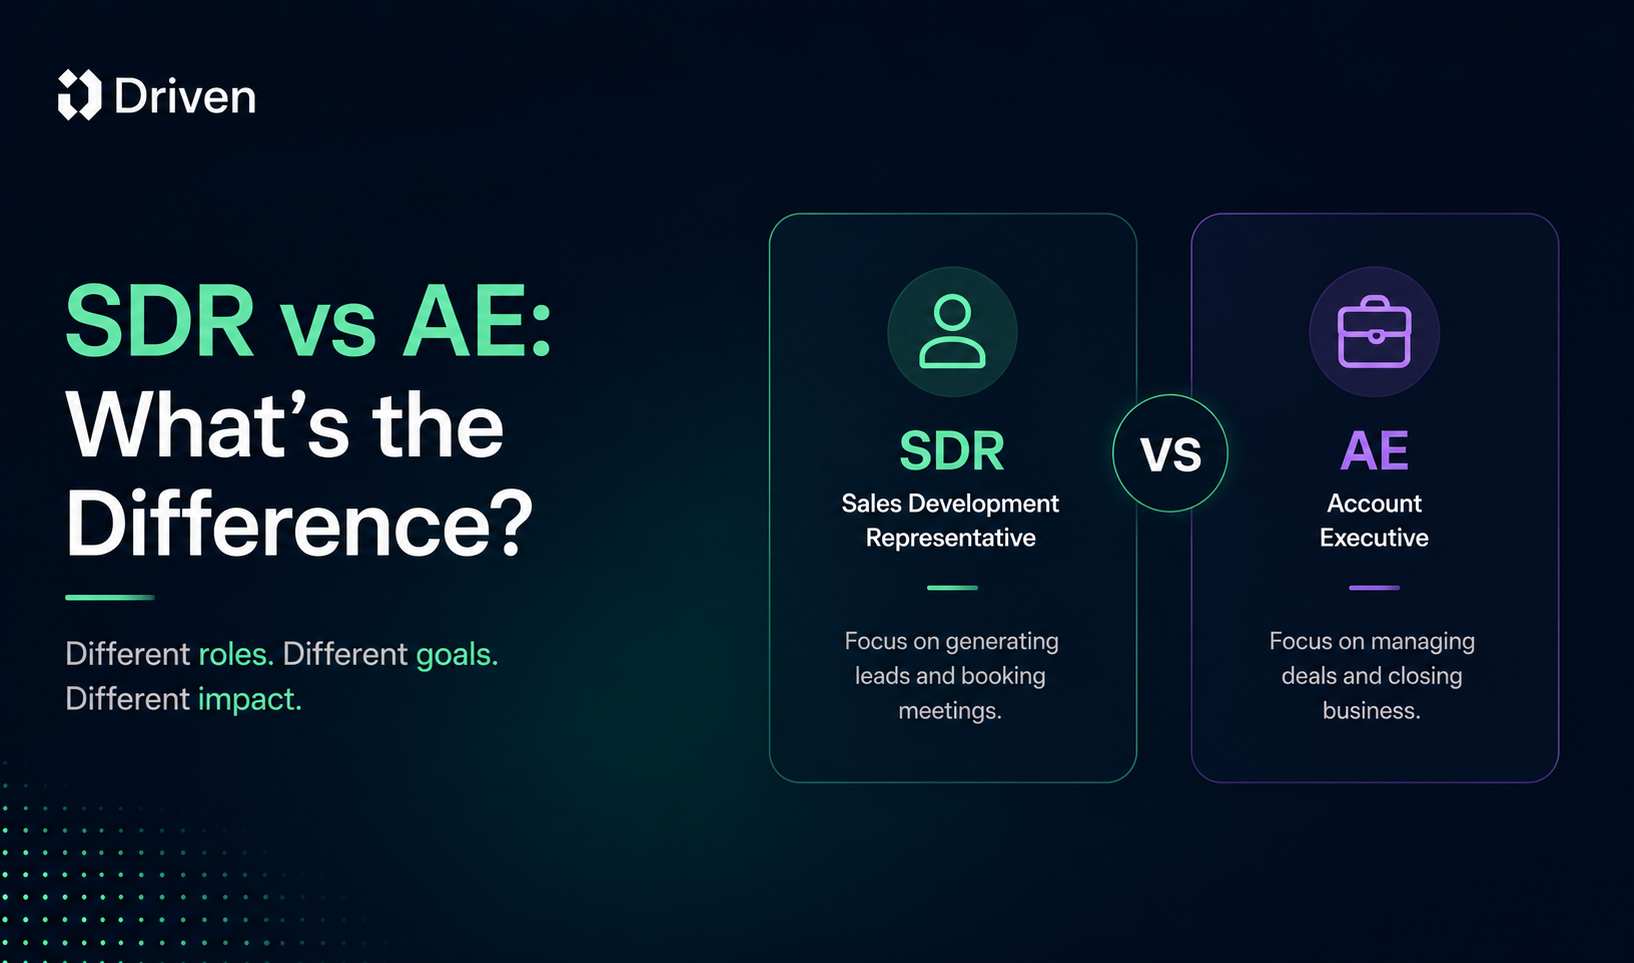
Not every sales role drives revenue the same way, so it doesn't make sense to pay everyone on the same plan. Yet plenty of companies still try to copy-paste one commission structure across the whole sales org, and then wonder why half the team feels underpaid and the other half feels unmotivated.
Sales Development Representatives (SDRs) generate qualified pipeline. Account Executives (AEs) close it. Their responsibilities are different, their quotas are different, and their performance metrics are different, which means their compensation plans need to be different too.
In this guide, you'll learn the key differences between SDR and AE roles, how their compensation plans are typically structured, common pay mixes and incentive models, mistakes companies should avoid, and how compensation software makes managing both plans easier as a team grows.
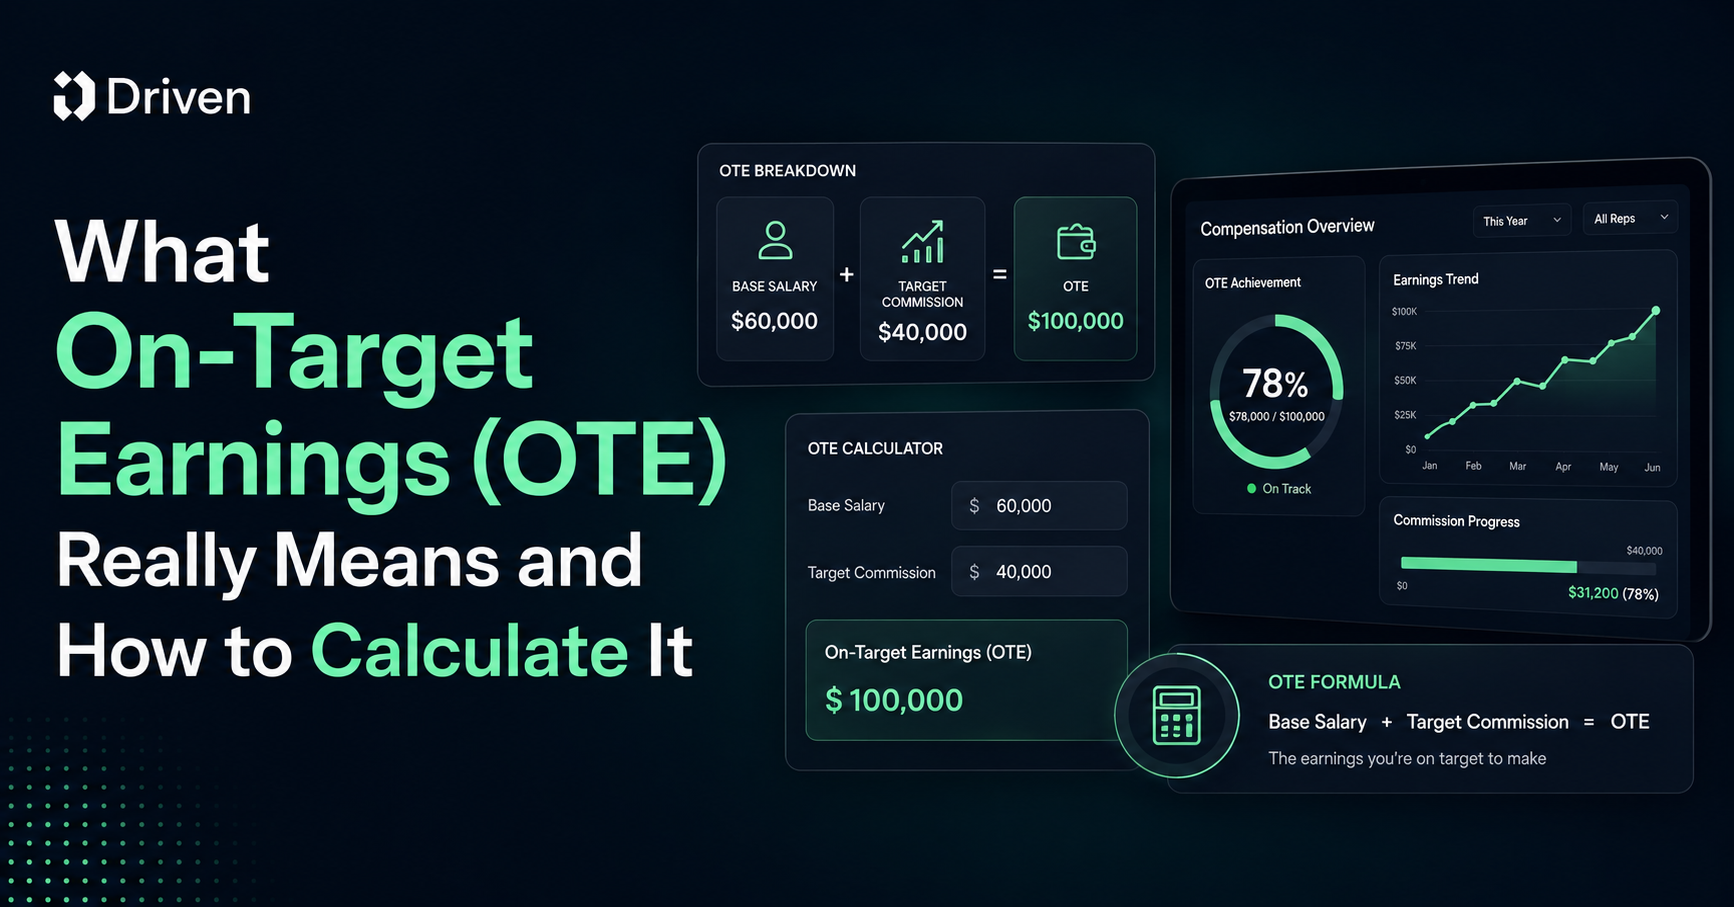
Ask ten sales reps what OTE means and you'll get ten different answers. Some think it's their salary. Some think it's guaranteed. Some think it's a number recruiters made up to make a job posting look better than it is.
On-Target Earnings, or OTE, is one of the most misunderstood terms in sales compensation, and that confusion costs people real money and real trust. Candidates accept offers they don't fully understand. Reps hit quota and still feel confused about their paycheck. Finance teams build comp plans that nobody on the floor can explain in one sentence.
This guide breaks down exactly what OTE means, how to calculate it, and how it's different from base salary and total compensation. You'll walk away knowing how to read an offer letter, build a comp plan, or explain your own earnings potential without the guesswork.
.png)
Revenue Operations has become the foundation of modern revenue teams in 2026. What once focused mainly on aligning sales and marketing now connects every revenue-related function, workflow, and process across the organisation. However, many companies still struggle with disconnected tools and fragmented systems. Businesses invest in CRMs, forecasting platforms, analytics software, customer success tools, and compensation management systems, but often end up with siloed data and inefficient workflows.
As a result, teams spend more time fixing operational issues than driving growth. A successful RevOps tech stack is not about having more software, it’s about ensuring every tool works together seamlessly. In this guide, we’ll explore how to build a connected RevOps stack that improves visibility, automation, and operational efficiency while reducing complexity. We’ll also look at how platforms like Driven help automate commission operations with AI-powered workflows.
.png)
Sales compensation has moved from a back-office payroll function to one of the most strategically important levers a revenue organisation can pull. For RevOps leaders, compensation data isn't just interesting; it's operational intelligence. The right benchmarks reveal whether your quota structure is realistic, whether your commission model is driving the right behaviours, whether your reps trust the plan they're working under, and whether your finance team is spending 40 hours a month on a process that should take four.
In 2026, the data tells a clear story: most organizations are underperforming on compensation design, overspending on manual administration, and underinvesting in the transparency that keeps sales teams engaged and motivated. This guide compiles the most important sales compensation statistics. RevOps leaders need to know this year and translate each data point into a practical implication for strategy and execution.
.png)
Sales compensation management is undergoing a major transformation. What was once a manual, rule-based, and spreadsheet-heavy process is now becoming more intelligent, automated, and insight-driven. At the core of this shift is artificial intelligence (AI) in revenue operations and commission management. Businesses are no longer just looking for tools that calculate commissions; they want systems that can think, analyse, and optimise.
Here's where things get confusing: what exactly is an AI commission agent, and how does it differ from conventional commission software? This blog explains it well. Most commission software calculates payouts. An AI commission agent goes several steps further, it analyses, predicts, automates, and even assists decision-making.
.png)
A sales team's compensation structure directly influences performance, motivation, retention, and revenue growth. When designed correctly, it encourages the right behaviors, rewards top performers, and aligns sales activities with business goals. When designed poorly, it can create confusion, reduce motivation, and drive unwanted behaviors.
Whether you're building your first sales team or refining an existing compensation plan, understanding sales compensation structures is essential for long-term success.

Most sales teams assume missed targets are a performance issue. When numbers fall short, the default response is to push harder: more calls, more pipeline, more pressure on reps. But that reaction overlooks a more fundamental problem. In many cases, the issue isn’t how your team is selling; it’s what they’re being asked to achieve. Quotas shape behavior, motivation, and outcomes, and when they’re set incorrectly, even strong teams struggle to perform.
The reality is simple: the quota itself might be wrong. Set it too high, and reps disengage. Set it too low, and you cap your revenue potential. Distribute it unevenly, and your top performers lose trust in the system. Despite this, many organizations still rely on spreadsheets and manual processes to define targets. If that sounds familiar, it’s a sign that your approach to quota setting may need a serious rethink

Sales compensation is not just about paying commissions; it’s about shaping behaviour, driving performance, and aligning teams with business goals. But here’s where many organisations go wrong: they design compensation plans without accounting for how their sales actually work.
B2B and B2C sales operate in fundamentally different environments. They differ in deal size, buyer complexity, and sales cycles. Yet, companies often apply similar compensation logic across both, and the result is predictable: misaligned incentives, inconsistent performance, and lost revenue opportunities. To build an effective compensation strategy, you need to start with a simple principle: how you sell should define how you pay.

If you’ve spent any time around startups, scaling companies, or even corporate teams, you’ve probably heard the term “Ops” thrown around in meetings, job titles, or strategy discussions. Sales Ops, Marketing Ops, RevOps, DevOps, it’s everywhere. But what does “Ops” actually mean in business? And more importantly, why has it become such a critical function for companies that want to grow efficiently.
The truth is, most businesses don’t struggle because they lack ideas or demand. They struggle because things break internally, processes are unclear, teams are misaligned, and execution becomes messy. That’s where Ops comes in. In this guide, we’ll break down what Ops really means, what it includes, and why it plays a central role in building a scalable, high performing business.

Most sales teams don’t fail because they lack effort or talent. They fail because the system meant to reward performance is too complex to understand. Commission plans are meant to drive behavior. But when they become overloaded with rules, tiers, exceptions, and calculations, they stop being motivational tools and start becoming confusion engines.
Modern compensation systems are evolving beyond manual design, with AI and automation reshaping how incentive structures are created and optimized. And once reps stop clearly understanding how their earnings work, performance drops, not because they stop trying, but because they stop trusting the system. This is becoming more important as AI is reshaping sales compensation systems and incentive design.

Most companies think they have a compensation problem. They don't; they have an alignment problem. Sales teams focus on what they’re paid to do, while leadership focuses on revenue growth, predictability, and profitability. When those priorities aren’t tightly connected, things start to break quietly at first, then all at once. Revenue targets are consistently missed, payouts increase without meaningful impact, and reps begin optimizing for incentives instead of outcomes.
Here’s the uncomfortable truth: if your compensation plan isn’t directly tied to revenue goals, it’s working against you. If you want to understand where sales compensation is heading, explore our take on the future of sales compensation.

In today’s performance driven business environment, companies are moving beyond fixed salaries and embracing compensation models that directly reward results. Variable incentive pay has become a cornerstone of modern compensation strategies, especially for sales and revenue teams. But while the concept sounds simple, designing an effective variable pay plan is anything but.
Done right, it can drive performance, boost motivation, and align teams with business goals. Done poorly, it can create confusion, mistrust, and missed targets. In this guide, you’ll learn what variable incentive pay is, the different types, its key benefits, and how to design plans that actually work in 2026 and beyond.

You can build a highly data driven, strategically aligned compensation plan and still see it fall apart within weeks of rollout. The reason is simple: your sales team may not fully understand it, trust it, or believe they can actually succeed under it. When reps feel uncertain about how they earn, even the best designed plans lose their impact.
In 2026, success in sales compensation isn’t just about plan structure or incentives; it's about how clearly and consistently changes are communicated. Sales teams today are more informed, more analytical, and more sensitive to fairness than ever before something closely tied to trends shaping the future of sales compensation and how AI is changing the game. When communication falls short, confusion grows and motivation drops. This blog breaks down how to communicate compensation plan changes in a way that builds clarity, trust, and adoption rather than resistance.
.png)
%20(1).png)
%20(1)%20(1).png)
.png)
.png)
%20(1).png)
%20(1).png)
%20(1).png)
A sales commission plan is meant to motivate your team—but when it’s poorly designed or misaligned with business goals, it becomes a silent revenue killer. Many companies underestimate how much damage a flawed compensation structure can cause because the problems don’t appear all at once. Instead, they compound quietly over months: reps chase the wrong deals, turnover increases, disputes rise, and forecasting becomes unreliable.
Meanwhile, leadership often looks everywhere except the comp plan to diagnose performance issues. The truth? Your commission structure has more influence over revenue growth, morale, and productivity than almost any other operational system. When incentives are unclear or unfair, even your best sellers give up. And when incentives are aligned and transparent, the entire organization accelerates. In this post, we break down the hidden financial costs of a poorly designed commission structure and how modern compensation systems are helping revenue teams eliminate those risks altogether.
.jpg)
Sales teams are the backbone of any revenue-driven organization, but even the most talented reps can underperform without the right incentives. A well-crafted sales compensation plan doesn’t just pay your team; it motivates, aligns, and drives consistent, high-level performance. Too often, companies rely on outdated spreadsheets, unclear quotas, or one-size-fits-all commission structures, leaving reps frustrated and sales results inconsistent.
In today’s competitive market, designing a compensation plan that balances fairness, transparency, and ambition is essential. This guide walks you through a tactical approach to building plans that reward the right behaviors, keep reps motivated, and ultimately help your business hit and exceed its revenue goals.
%20in%20Sales%20(1)%20(1).png)
In today’s competitive business environment, sales teams need more than just enthusiasm and product knowledge; they need direction, focus, and measurable goals. This is where Management by Objectives (MBO) comes into play.
MBO isn’t just another management buzzword; it’s a proven approach that helps organizations align their goals with individual performance. By setting clear, achievable objectives, MBO transforms how sales teams operate, helping them stay focused on what truly matters, driving results. But what exactly is MBO, and how can it revolutionize your sales strategy? Let’s explore in depth.
Sales compensation software has moved far beyond spreadsheets and manual commission tables that are prone to errors, delays, and confusion. Modern compensation platforms now help businesses design fair and motivating compensation plans, automate even the most complex commission calculations, accurately forecast payout costs, and improve transparency across the entire sales organization. By providing real-time visibility into earnings and performance, these tools keep sales teams motivated while helping finance leaders maintain control over budgets and revenue planning. In a world where sales velocity, scalability, and revenue predictability matter more than ever, choosing the right sales compensation software can truly transform how your revenue organization operates and grows.
In this guide, we review the best sales compensation software available today, compare their key features, pricing models, and ideal use cases, and help you confidently choose the platform that best fits your business goals.
.png)
%20and%20Why%20It%20Matters%20(1).jpg)
In today’s competitive business environment, achieving consistent sales growth is a challenge. Organizations often face real challenges when it comes to keeping sales teams motivated, tracking performance accurately, and making sure everyone’s efforts support the company’s bigger goals. Sales Performance Management (SPM) helps bring clarity to all of this. Instead of just offering tools, SPM provides a structured, fair way to evaluate performance, reward the right people, and strengthen the entire sales process so revenue grows consistently.
In this blog, we’ll explore what SPM is, why it matters, its core functions, the benefits it brings, the risks of operating without it, and how to choose the right SPM solution for your business.
%20(1).png)
If youʼve ever tracked commissions in a spreadsheet, you know how messy it can get, late nights fixing formulas, endless back-and-forth with sales reps, and disputes that eat into everyoneʼs time. What feels “cheap and easyˮ at first quickly turns into a drain on productivity and trust. On top of that, most salespeople donʼt fully understand their complex compensation plans when theyʼre buried in Excel formulas, which only adds to the confusion. Automated sales compensation software solves both problems: it not only removes errors but also clarifies commission plans so reps know exactly how theyʼre being paid.
And the numbers back this up: studies show that nearly 9 out of 10 spreadsheets contain errors. For something as critical as sales compensation, even a small mistake can cost thousands of dollars, spark disputes, and leave reps questioning their pay. The reality is simple: manual commission tracking isnʼt just inconvenient, itʼs costly. In this blog, weʼll uncover those hidden costs, compare manual vs automated commission tracking, and explore how automation transforms commission management from a constant headache into a driver of growth and transparency.